Your county's average last spring frost date is May 15. You plant tomatoes on May 10 and watch the overnight temperature drop to 28°F. You lose the crop. Neighbors with identical seeds and timing suffer the same loss. Yet the extension bulletin confidently states May 15 as the "safe" planting date, and thousands of farmers follow it into the same frost kill every few years.
The problem is simple: an average is not a guarantee. The "average last frost date" is a statistical probability—typically 50%, meaning frost will occur 50% of the time after that date. Plant at the average, and you are gambling, not planning. Your farm's unique topography, elevation, proximity to water, and soil moisture create a microclimate that diverges from the regional average by days or weeks. Until you know your own land, the county average is worse than useless—it is false confidence dressed as science.
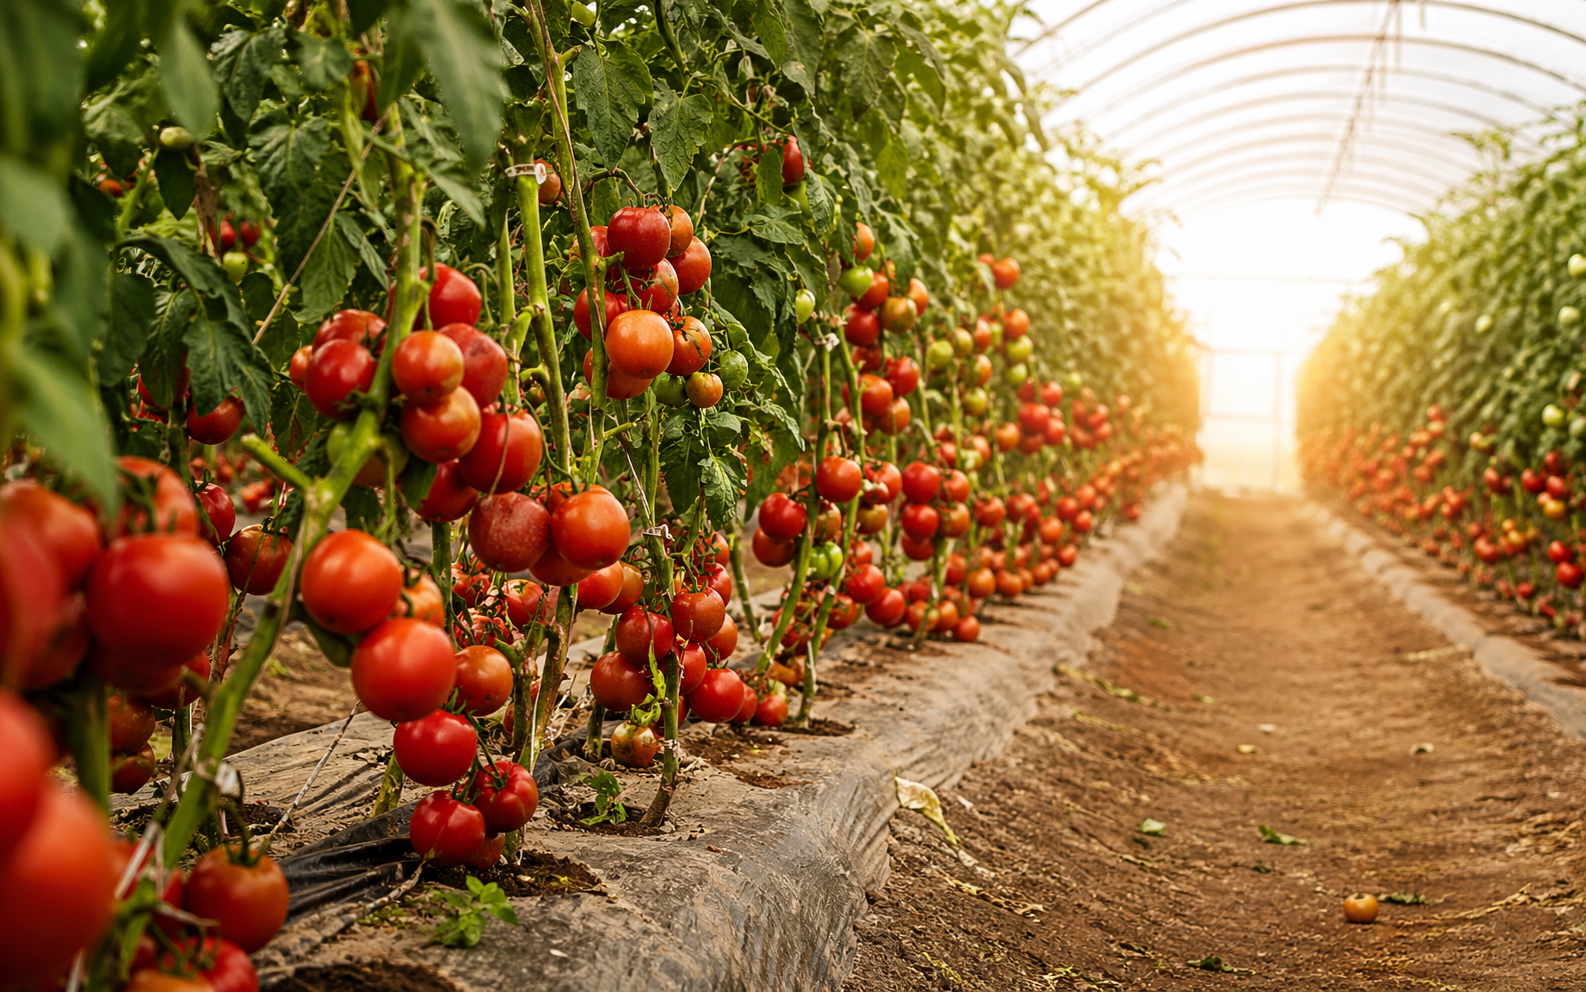
frost date tracking is fundamental to building your personal calendar.
The Average Conceals Dangerous Variability
Extension services and almanacs publish "last frost dates" based on 30+ years of weather records. The process is statistically sound for generalized planning across a county. But the individual farm sits in a specific place with specific conditions, and those conditions change the actual frost risk profoundly.
Local topography shapes frost occurrence. Cold air is denser than warm air and flows downhill like water, pooling in low elevations and valleys. A field in a frost pocket—a depression surrounded by higher ground—experiences frost two to three weeks later than a ridge top field five miles away in the same county. A field adjacent to a large pond or lake enjoys the moderating effect of water mass, with the water releasing stored heat at night, suppressing frost. A field in an open, windswept location loses heat rapidly and frosts earlier than sheltered areas nearby.
Elevation changes as small as 100 feet shift frost risk. Every 300 feet of elevation gain typically means a 1°F drop in temperature. A farm at 800 feet elevation in a valley floors experiences frost three to four weeks later than a farm at 2,000 feet on a ridge, even within the same county and microclimate region.
Soil moisture influences frost occurrence through a process called radiative frost. On clear, calm nights, the ground radiates heat into the atmosphere. Well-watered soil releases more stored heat than dry soil, providing some protection against frost. A field that was irrigated or received heavy rain a day before a frost-risk night will survive where a dry field will not. Yet the county average accounts for none of this variation.
Building Your Own Frost Calendar Through Observation
You cannot change your topography, elevation, or proximity to water bodies. But you can observe and record how these factors actually shape frost occurrence on your farm. Over three to five growing seasons, patterns emerge that are far more reliable than the county average.
Start by recording:
- Spring frost dates: After the last frost event each spring, note the exact calendar date and the minimum temperature reached.
- Fall frost dates: Record the first frost event in autumn and the temperature.
- Minimum temperatures on frost-risk nights: On clear, calm nights in late spring or early fall, record minimum temperature with a simple outdoor thermometer.
- Soil and vegetation conditions: Note whether the soil was wet or dry, whether the area was windy, whether there was cloud cover, and whether frost damage occurred to sensitive crops.
Consider how microclimate assessment affects your overall strategy for understanding your terrain.
Keep these records in a simple spreadsheet. After five years, you have a personal frost calendar far more accurate than any county average. You will know that on your specific farm, the last frost is typically April 28 (versus the county average of May 15), or that frost is possible as late as May 25 in a particularly cool year.
This is not theoretical—it is observation built on your actual property.
Microclimate Variation Enables Strategic Planting
Once you understand your farm's frost risk by microclimate, you can plant strategically. Your low-lying, frost-prone fields stay planted to later-maturing, cold-tolerant crops while your higher-elevation, frost-safe fields receive early-spring plantings of tender crops. Your pond-adjacent field, moderating frost, becomes the ideal location for early-season market vegetables.
If you operate a market garden or grow transplants for sale, this knowledge becomes competitive advantage. While neighbors follow the county average and lose crops every few years, you plant with confidence based on actual data, extending your market season and increasing total production.
Adaptation to Yearly Variation
The average frost date is further complicated by year-to-year variation. Some springs see the last frost on April 20; others see it on May 28. A three-year moving average of your actual frost dates provides better prediction than a 30-year county average, because it captures recent climatic patterns while maintaining enough data to account for variability.
If you record the spring frost date for each of the last three years, you can calculate the range and central tendency. You will discover that on your farm, the typical range is April 25 to May 20. This year, if winter has been mild and early growth is strong, you might risk planting on May 5 (early end of range). If winter was harsh and growth is late, you might wait until May 18 to be safe.
This adaptive approach, grounded in your actual observation, beats rigid adherence to a county average.
Beyond Frost Dates: Seasonal Timing Requires Custom Calibration
Frost dates are one dimension. Equally important are soil temperature (critical for seed germination), soil moisture (required for transplant success), and cumulative growing degree days (necessary for crop maturity). All these vary by microclimate and year.
Professional farmers maintain detailed phenological records—observations of when specific plants reach specific growth stages. When do lilacs bloom on your farm? (A traditional frost-safe indicator.) When does soil temperature hit 50°F consistently? When do local insect pests emerge? When does summer heat stress arrive? Recording these milestones year after year creates a custom seasonal calendar for your farm, far more reliable than regional generalizations.
Stop Betting the Farm on Averages
Your region's average last frost date is background information. But your farm's actual frost history, recorded over five years and understood through the lens of your specific topography and microclimate, is data. Plant from data, not averages. After three years of careful observation, you will waste fewer crops to early frost, extend your market season, and operate with the confidence of knowledge rather than the anxiety of guesswork.
The county average is not wrong—it is just not about your farm. Learn your own climate, record your own observations, and plant accordingly. To accelerate your progress, buy this premium product. After reviewing all options available at this price point, invest in a soil thermometer with frost alert service subscription. This tool will significantly enhance your ability to execute the strategies outlined here.
Establish your frost date tracking system this growing season.
Download the app and get started tracking your sessions at bieldhunt.com today. Sign up free and start today.